Profilers - AsyncProfiler and Parca
Sometimes you want to profile your open source clustered cache, but no one will give you a free license for it. So here's a TLDR note on the various kinds of profiling and profiler technologies. Includes fleet wide continuous profiling using eBPF based profilers.

Async Profiler
Async profiler is a low overhead, sampling profiler with support for OS events - hardware counters, lock contention and ofcourse CPU usage and memory allocation.
It uses multiple profiling engines:
- PerfEvents - hardware counters, CPU
- AllocTracer - heap allocations
- MallocTracer - native memory allocations
- LockTracer - lock contention
One of the problems it solves which other sampling based profilers suffer from is the safepoint bias. It solves this by using async sampling.
Safepoint Bias
A safepoint in the JVM is a point at which the JVM can perform internal tasks, including: GC, deoptimization, biased lock revocation, stack walking and class redefinition.
To reach a safepoint, each Java thread must hit special “polling” locations which is inserted by the JVM. Some profilers are safepoint only profilers. They force a global safepoint rather than waiting for one to occur.
while(true) {
    x = x * 2;
}
Undersampling of Tight Loops
Because of this requirement, we end up with a sampling bias. A thread running a tight loop without safepoints ends up being undersampled, whereas regular threads running normal code without a tight loop end up being relatively over-sampled as they can reach a safepoint much more frequently.
Perf Events
Under the hood Async Profiler uses perf_events to capture native call stacks as well as CPU metrics like cache misses. You can also access these yourself directly using perf (you may have to build the latest one from mainline).
AsyncGetCallTrace
This is a function in C (asyncGetCallTrace.cpp) provided by the JDK that allows profiling tools and agents to capture a stack trace at arbitrary moments in time:
void AsyncGetCallTrace(ASGCT_CallTrace *trace, jint depth, void* ucontext);
Where ucontext is the CPU register state of the interrupted thread, trace is the output frames and depth is the max frames to collect.
Profilers can call this function over the JVM TI agent interface. This allows profilers to decode the Java stack.
What is JVM TI?
JVM TI (Java Virtual Machine Tool Interface) is the official low-level native interface that the JVM exposes so tools can interact with a JVM from native code (C/C++). It is also used by debuggers to do things like insert breakpoints, force GC, re-write bytecode etc.
eBPF Profilers
What is eBPF?
The enhanced Berkely Packet Filtering library is a way of running code inside the kernel - it's often used for packet filtering as the name implies, but there are a whole host of continuous profilers built on this technology.
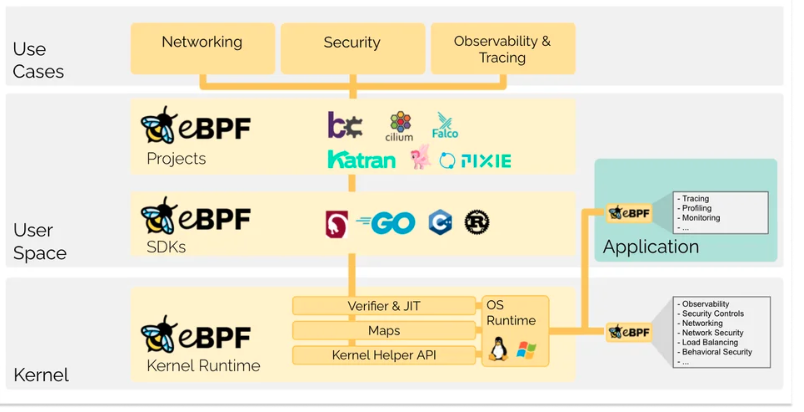 Source - ebpf.io
These are profilers which essentially run all the time - you can install them as Daemonsets on your K8s cluster and have each one report back to it's centralised backend for visibility.
A profiler that uses eBPF also doesn't suffer from safepoint bias - it can sample asynchronously because it runs directly in the kernel without using the AsyncGetCallTrace public API using the JVM-TI.
Trade Offs
You won't get good visibility to allocations or line level precision, but you have JFR and Async Profiler for that.
Links and References
https://github.com/async-profiler/async-profiler
https://github.com/parca-dev/parca
https://stefan-marr.de/2024/09/instrumenation-based-profiling-on-jvms-is-broken/